Jean-Yves Mengant
Legal Notice
http://jpydbg.blogspot.com/
Permission is granted to copy, distribute and/or modify this document under the terms of the GNU Free Documentation License, Version 1.1 or any later version published by the Free Software Foundation; with no “Invariant Sections”, “Front-Cover Texts” or “Back-Cover Texts”, each as defined in the license. A copy of the license can be found in the file COPYING.DOC.txt included with jEdit.
The JpyDbg plugin itself is released under the GNU General Public License. A copy of the GPL can be found in the jEdit online help.
Table of Contents
- 1. What is JPyDbg for JEDIT and NETBEANS
- 2. Installing and Customizing JpyDbg plugin
- 3. Switching between CPython and Jython
- 4. Inspector Module/Class viewing and python syntax checking
- 5. NETBEANS / JEDIT differences
- 6. A debugging session primer
- 7. modifying variable values during debugging
- 8. Remotely debugging python programs
- 9. using the import navigator panel
- 10. using pylint
- A. Change log
JPyDbg is hosted and managed as a FSF sourceforge project. you can reach sourceforge JpyDebug project homepage and last news from here
JpyDbg is a Multi Ide Python / Jython development environment which has been originally implemented inside JEdit as a JEdit plugin . Starting with version 0.0.14 most of JEdit Python Development Environment have been made available from inside the Netbeans IDE as well as a standard NBM package.
Starting with version 0.0.11 JPyDbg is able to debug CPYTHON and a JPYTHON(JYTHON) sources.
I Started working on JpyDbg since summer of 2002 and as time goes on I added numerous complementary functionalities to it since. By beeing maintained by a Python / Java daily developper (who is by the way the first user of JpyDbg) most annoyances should be fixed quickly... BTW version number is still 0.0.xx just because I consider that even if the debugger is pretty stable now, there is still on going improvement on it , which makes me keep the current version number starting with 0.0.
As far as I know JPydbg was the first python debugger which implements the Jython and CPython debugging facility, which by the way make it also a very powerfull tool for checking the portability of python code between CPython and Jython.
Installing and using either netbeans or jedit is a prerequisite for using JPyDbg : jedit and netbeans are both opensource projects.
Usually version found at jpydbg site and in jedit downloadable pluggins are in sync ; so you can pick it at both locations ; But sometimes the version found at jpydg site may be more recent.
I Try to provide only stable versions allthough some bugs may pass through my checks.
Figure 1.2. JpyDbg clean client/server based debugging architecture
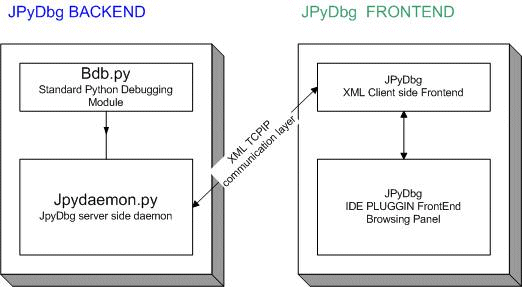
JPyDbg server side is a Python Module and the currently provided client side are written in Java , this implies that JPyDbg is platform independent and can be used on any platform where Python and Java are available.
-
JPyDbg BACKEND :
-
This part is a TCPIP socket based python module inheriting its basic debugging features from the bdb.py standard debugging module.
-
The socket layer is used to receive Debugging commands from the FRONTEND layer and populates debugging informations back using XML
-
-
JPyDbg FRONTEND :
-
This part is responsible of displaying the debugging informations to the end user.
-
The idea is that there may be more than one way to do it , since there is more than one IDE available to develop python projects.
-
A first one has been made available for JEdit IDE environment , as a starting point
-
In january september 2006 a new implementation of JpyDbg for netbeans IDE environment has been dropped .netbeans IDE has the major advantage of beeing built using Swing GUI library like JEdit which provides good portability of some existing component panel used for Jedit
-
I'll try to maintain both version in sync in the future
-
The jedit jpydbg plugin may be easily automatically installed from jedit plugin central using the jedit Plugin Manager from inside jEdit. The only problem is that the available jpydbg version available from plugin central may not be the most recent version of jpydbg. In that case use the following procedure to install
jpydbg pluggin jar must be installed as usual in the JEdit jar directory details follow for UNIX/MAC OSX and WINDOWS
Example 2.1. manually installing jedit jpydebug plugin on UNIX / MAC OSX.
    rm .jedit/jars/jpydebug*.jar                                      # remove any previous version of jpydbg jar
    cp jpydebug-x.x.xx.jar .jedit/jars                                # copy last version of jpydebug jar under user .jedit home jars (visible for current user)
 or cp jpydebug-x.x.xx.jar $JEDIT_HOME/jars                           # copy jpydebug jar under $JEDIT_HOME/jars path (visible to multiple users if
                                                                      # Jedit is under /usr/local + su root requested
Example 2.2. manually installing jedit jpydebug plugin WINDOWS.
    delete C:\Documents and Settings\userid\.jedit\jars\jpydebug*.jar  # remove any previous version of jpydbg
    copy jpydebug-x.x.xx.jar C:\Documents and Settings\userid\.jedit\jars\jpydebug.jar # copy jpydebug jar under user .jedit home jars (current user)
 or copy jpydebug-x.x.xx.jar %JEDIT_HOME%\jars\                        # copy jpydebug jar under $JEDIT_HOME/jars path (visible to multiple users)
Tip
The Jedit Jython plugin may conflict with JpyDbg in the sidekick Structure Browser ; if you plan to install both pluggins its' important to use version 0.9.1 of the JythonInterpreter plugin ; higher version of Jython interpreter pluggin like 0.9.6 may have a sidekick conflict with jpydbg : check for a service.xml file inside the JythonInterpreter pluggin's jar and remove it : this should resolve the sidekick conflict.
JPYDBG : Starting with version 0.0.11 of jpydbg,the jython.jar Jython library is requested and must be installed under jedit jars subdirectory, this jar library is part of the standard Jython distribution which can be found at http://www.jython.org http://www.jython.org
NETBEANS : for Netbean's users the jython jar is already packaged inside the nebeans NBM jpydbg package and populated accordingly by the automated NETBEANS instal process ; to install for netbeans , simply download the .NBM jpydbg file and jump to the NETBEANS tools / Update center wizard ; select 'install manually downloaded module' ; press next ; add the jpydbg .NBM downloaded file to the list and you're almost done.
A running version of CPython is requested (2.2 , 2.3 or 2.4 version are acceptable ) see http://www.python.org for details.
A python counterpart module, used for the backend part of debugger is also provided in source format using a standard python module distribution , so a separate complementary jpydaemon-xxx.zip (where xxx represents the current version number of the module) is provided and need to be downloaded as well , unzipped into a work directory (/tmp).
Tip
Starting with version 0.0.14 of jpydbg ; python modules are automatically installed during the first activation of jpydbg pluggin for Jedit or Netbeans ; you only need to install the python backend debugger package for remote python debuging on the remote machine only. So if you only plan python local debuggin you're done
Next in order to install the python backend debugger stuff for remote debugging just proceed as follow on the remote machine:
Example 2.3. installing jpydbg python modules
    cd /tmp
    unzip jpydaemon-xxx.zip
    python setup.py install   # root priviledges may be requested here on unix
A running version of Jython is only requested if you plan to use the Jython debugging framework. Even if you only use Jython ; a working version of CPython is still requested , since the Python syntax checker uses the CPython AST tree analyzer
JEDIT : JPyDbg customization panels are made accessible through the Global options-pluggin-python-debugger's option menu bar
NETBEANS : JpyDbgcustomization panels are made accessibles through the Tools / jpydbg configuration menu.
Next the layout of the misc configuration panels are almost the same for both IDE environments
multiple customization subpanels are made available and described bellow :
- CPython options :
-
specify informations about CPython framework.
- JPython options :
-
specify informations about JPython environment.
- debugger's options :
-
contains the python debugging configuration panel.
- program arguments :
-
provide a simple way to define python debugging configuration key used to populate runtime command line arguments to debuggees before starting a debugging session
- pylint options :
-
Pylint customization options
- profiler's options :
-
Python profiler's usage options(UNDER DEVELOPMENT)
- Python shell options :
-
provide customization color's choices for the Python shell window panel
Figure 2.1. CPython options for JEDIT
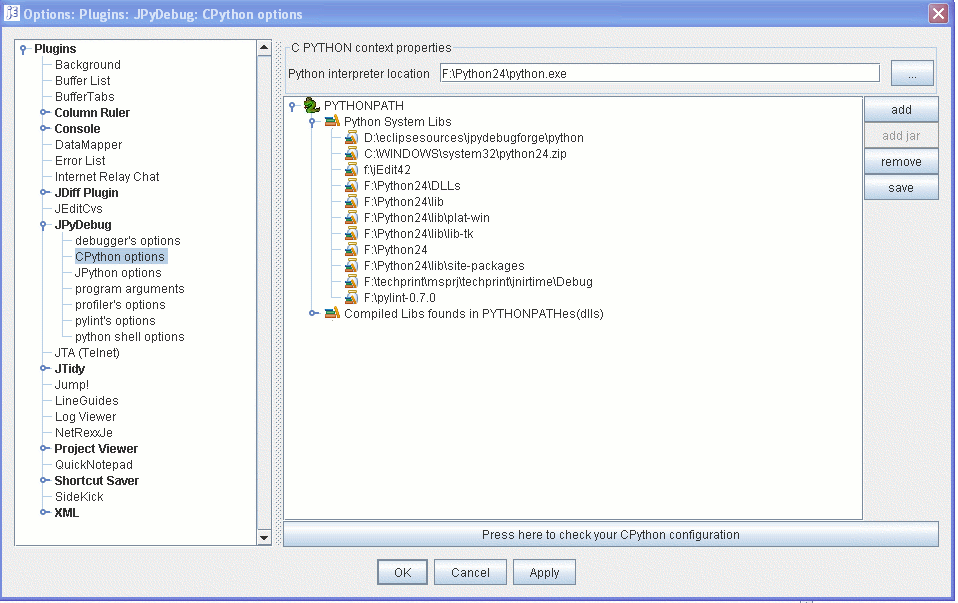
Figure 2.2. CPython options for NETBEANS
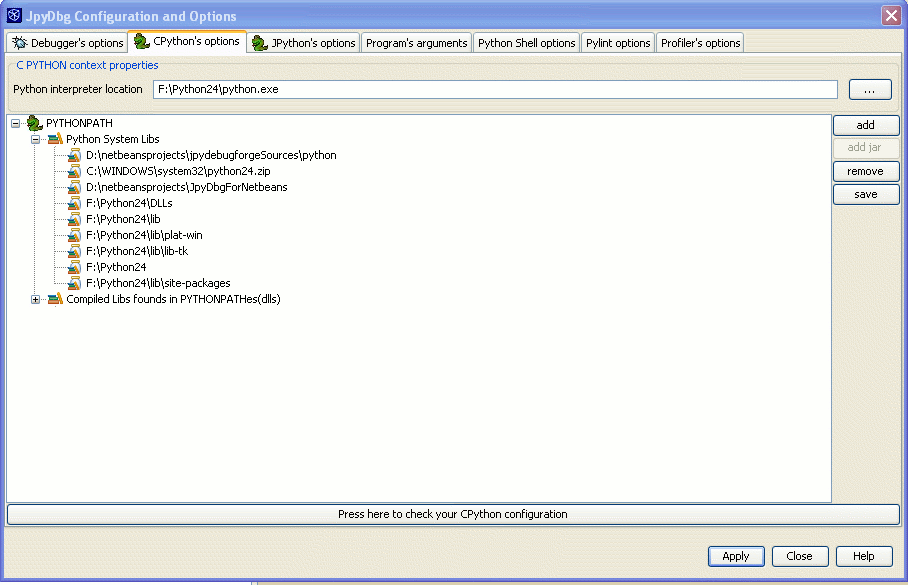
configuration panel fields description
- python interpreter location
-
define the full path location of the python interpreter program on your computer
- Python PYTHONPATH tree management
-
add or remove PYTHONPATH directories or jar file by selecting a node and right clicking to gain access to pythonpath popup menu
- Press here to check your CPython configuration
-
This button will launch a simple Python program and get green colored or red colored if launching failed , this is a convenient way for checking that your Python configuration is operational
Figure 2.3. JPython options for JEDIT

Figure 2.4. JPython options for NETBEANS

configuration panel fields description
- Jython's JVM location
-
define the full path location of the Java Virtual machine(java.exe or java unix binary program) location on your computer
- Jython's Home path
-
define the full path location of the Java Virtual machine(java.exe or java unix binary program) location on your computer
- use Jython as default python environment
-
JpyDbg default debugging to CPYTHON , toggle this checkbox to make Jython beeing the default debugging environment
- Jython PYTHONPATH tree management
-
add or remove PYTHONPATH directories or jar file by selecting a node and right clicking to gain access to pythonpath popup menu
- Press here to check your jython configuration
-
This button will launch a simple Jython Swing program and get green colored or red colored if launching failed , this is a convenient way tocheck that your Jython configuration is operational
.
Figure 2.5. Debugger's options for JEDIT

Figure 2.6. Debugger's options for NETBEANS
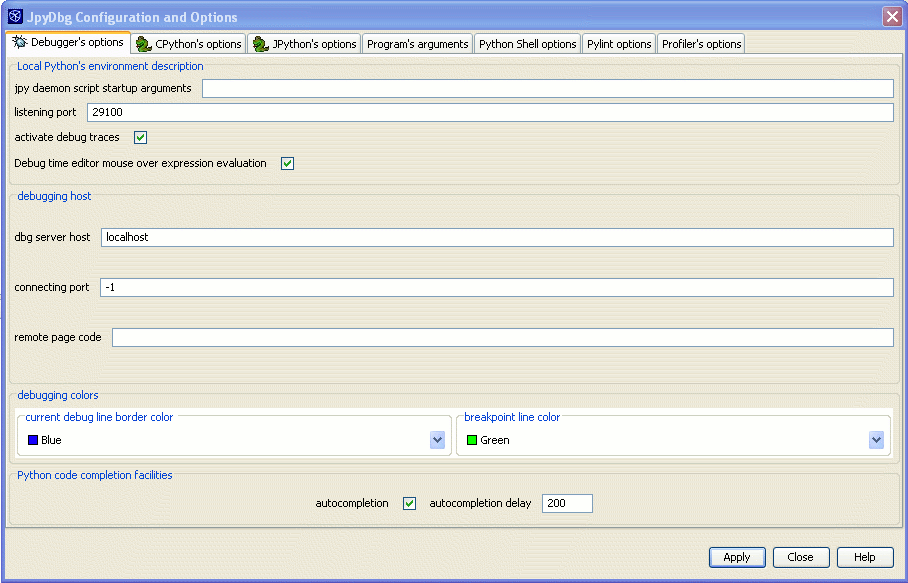
debugger's options fields description
- jpy daemon script startup arguments
-
provide here extra argument to jpydaemon(usually left empty)
- listening port
-
local listening port used by jpydbg pluggin to receive debugging events from jpydaemon.py
- remote page code
-
Unicode page code to be used for remote debugging if the remote machine is not ascii( CP037 = EBCDIC)
- activate jEdit debug trace
-
checking this box enables debug jpydbg traces to be displayed inside jEdit standard log
- debugging time editor mouse over expression evaluation
-
starting with version 0.0.9 of jpydbg , python expression evaluation may be directly displayed inside inside the source by either pointing the mouse over the expression or selecting a given expression from the source and moving the mouse over the selected area.
- dbg server host
-
ip address hosting jpydaemon => localhost when debugging python module on local machine
- connecting port
-
port to connect when daemon is listening instead pluggin => set to -1 when listening port is specified for pluggin
- current debug line debugging color
-
Choose the border color of current debugging source line
- breakpoint line color
-
Choose the color of breakpoint set lines
- activate autocompletion
-
starting with version 0.0.10 checking this box will enable python autocompletion to be activated inside the editor
- autocompletion delay
-
requested delay before autocompletion request is activated when typing inside the editor
Figure 2.7. JpyDbg debuggee's program argument settings for JEDIT

Figure 2.8. JpyDbg debuggee's program argument settings for NETBEANS
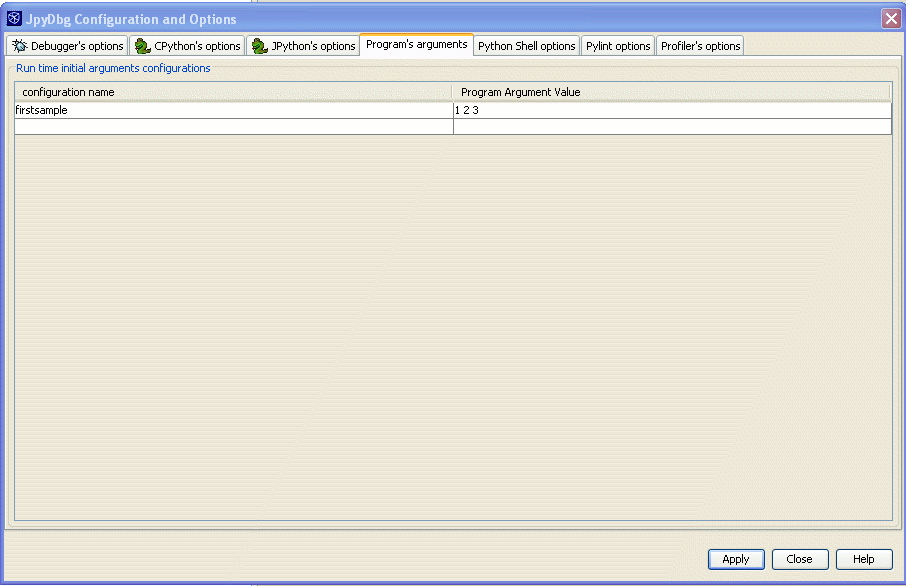
program arguments settings fields description
- configuration name
-
a short name identifying a given argv command line , this short name is populated in the command line combo box located on the debugging toolbar. Selecting a given short name keyword before launching a debug session will populate associated program argument values into the sys.argv python argument list
- program argument value
-
associated command line argument values
Figure 2.9. JpyDbg debuggee's PyLint options settings for JEDIT

Figure 2.10. JpyDbg debuggee's PyLint options settings for NETBEANS

Pylint options settins
- Use pylint
-
Toggle button to indicate wether or not Pylint checking should be activated or not.(pylint needs to be downloaded and installed from official pylint site)
- Pylint location
-
location of the pylint python module to use( usually lint.py)
- complementary arguments to pylint
-
Compleme,tary pylint options to be set ; in order to avoid too many messages you may set :
--persistent=n --comment=n --disable-msg=W0103,W0131,C0103,W0312,W0511
as Pylint option complementary arguments.
- Communicate FATAL , ERROR , WARNING , CONVENTION , REFACTOR
-
List of Pylint message category to be set ; FATAL and ERRORS are displayed as Jeit ERRORS others are displayed as jEdit WARNINGS
Figure 2.11. JpyDbg python shell coloring and font chooser settings for JEDIT
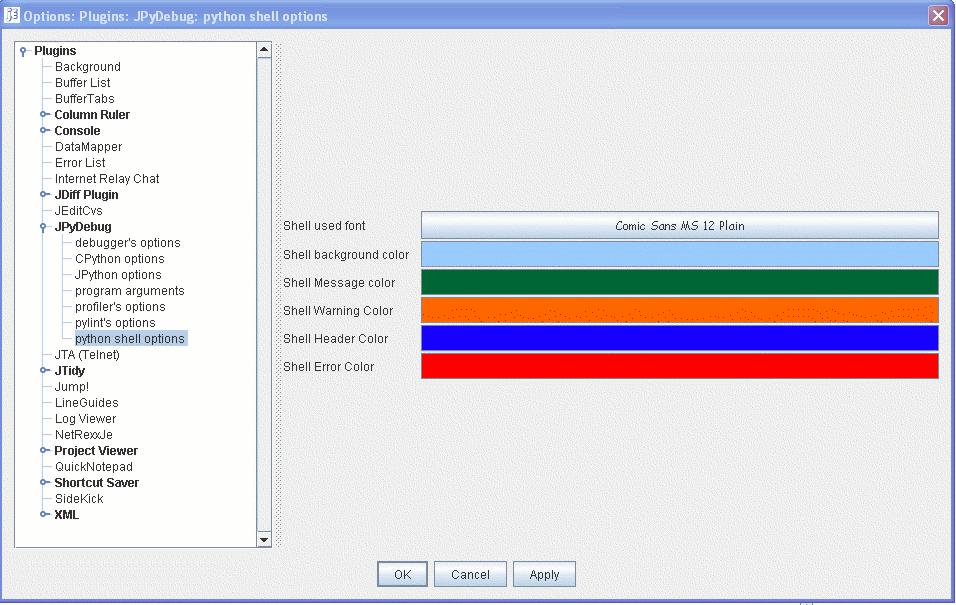
Figure 2.12. JpyDbg python shell coloring and font chooser settings for NETBEANS
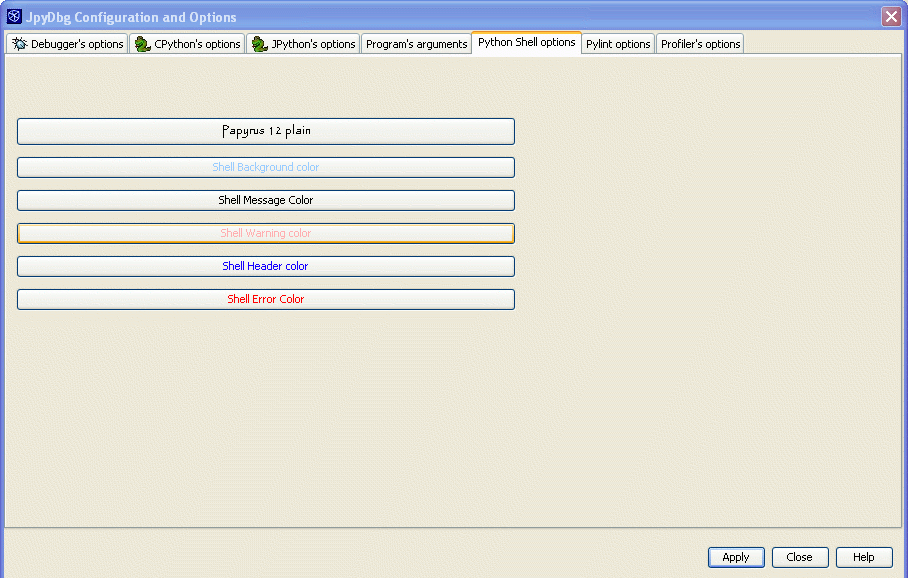
Python shell coloring customization description
- Color/font choosing
-
for each provided color or font choice just click on either the font chooser or color chooser button in order to pop up a color/font chooser , make the requested color/font change and press the apply button. This coloring group applies to the python shell command customization where user may enter dynamic python statements while debugging
Starting with V0.0.10 version, JPyDbg is both able to handle standard CPYTHON debugging session as before , but alsos JPython debugging session as well. (BTW AFAIK JpyDbg is the only debugger able to handle Cross Python debugging).
This feature is very usefull when you need to maintain Python module compatibility between both available Python environments
This feature is also possible because JpyDbg debugging kernel is fully written in Python and inherits the standard bdb.py debugging module as a starting point
Switching from CPython debugging To Jython debugging is straigforward and provided through a simple toggle button on JpyDbg toolbar
Since The Jython debugging feature is new in V 0.0.10, it may be less stable than the CPython debugging environment
The choice between a CPython debugging session and a Jython one must be made before the debugging session starts , as soon as the debugger is active the JPython/CPython toggle button is disabled until the end of the debugging session.
Figure 3.1. JpyDbg Cpython debugging toggled

Figure 3.2. JpyDbg Jython debugging toggled

Tip
When debugging Jython / Swing modules , the bdb.py thread is unexpectly quiting allthough java AWT threads are still active. This prevents the capacity of debugging Awt events. This problem is not a JpyDebug bug either a jython / bdb one ; in order to workaround it you may use the tip provided below inside the main task of your Jython module
Example 3.1. JYTHON / SWING A way to prevent main bdb Thread to exit
"""\
Equivalent to the ../awt/simple.py example but using swing components
instead of AWT ones.
"""

# This line will import the appropriate swing library for your system (jdk 1.1 or 1.2)
import org.python.core
from pawt import swing
import java
leaving =0

def exit(e):
  leaving = 1
  java.lang.System.exit(0)

frame = swing.JFrame('Swing Example', visible=1)
button = swing.JButton('Close Me!', actionPerformed=exit)
frame.contentPane.add(button)
frame.pack()
frame.show()

import time
while not leaving:
  time.sleep(1)
Starting with V0.0.5 version of JPyDbg which integrates the SideKick plugging facility , JPyDbg automatically checks the current PythonSource view for Syntax errors and populates any python Syntax Error found inside the ErrorList as shown bellow.
Figure 4.1. JpyDbg python syntax error checking

As soon as a given Python source is syntaxically correct the structure of the vurrent view Python source will be displayed inside a Jedit SideKick windows as shown on the following figure :
Tip
starting with version 0.0.9 JEdit files loaded through the FTP plugin are also displayed inside the syntactic tree , imported nodes are also displayed inside the tree
Figure 4.2. JpyDbg python syntax error checking
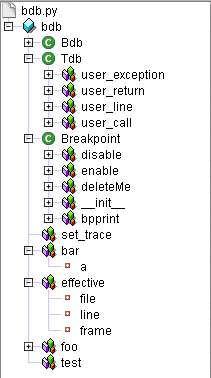
All the above syntax and semantic goodies are provided through the call of the inspector.py python module checker which is part of the jpydbg python package
Depending on the way you configured your JEdit environment the Sidekick window may be either floating or docked on left or right side of the jedit ; the python structure is provided to the JPyDbg Java browser through an xml file having the same name as the py file but with an .xml extension.
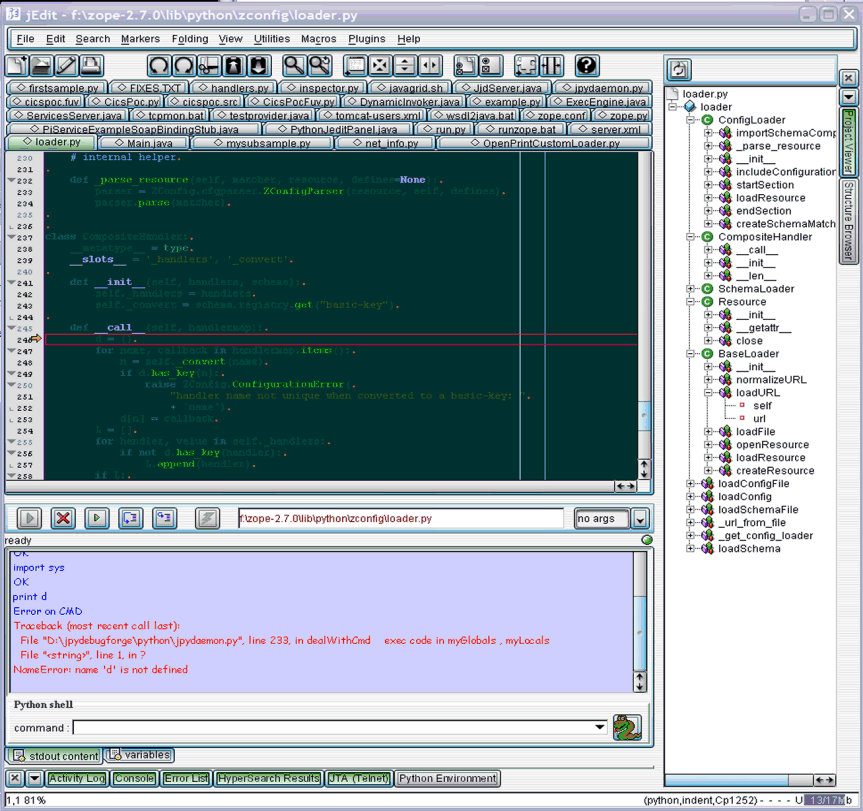
The sidekick Python syntax tree provides an interesting way to use JEdit to develop complex Python project. The figure below shows JpyDbg debug session over the Zope kernel.
Figure 4.3. a JpyDbg Debugging session of Zope kernel
Inside This chapter , I will point out the most important usage diferences that you may encounter using jpydbg with NETBEANS or JEDIT
Since both NETBEANS and JEDIT have Java/Swing Based GUI A lot of panel are shared between both Plugin implementation ; this make the compatibility between both plugin easier to maintain as well ; By the way let me emphasize here about the nighmare it would have been to port this to the ECLIPSE / SWT framework ... Almost every GUI stuff should have been completely rewriten ... Don't bet on SWT/SWING compatibility box there ; it's just a Marketing toy !!!!
OK back to the JEDT/NETBEANS stuff : One of the main difference is the location of the debugging bar
WITH JEDIT : Since there is no Debugging standard framework defined for JEdit , the debugger toolbar is located in the 'NORTH area' of the 'Python Environment' window panel.
WITH NETBEANS : The debugging launcher bar has been integrated with the current selected Python source action bar ; and the Debugging actions follows the standard Netbean's debugger partern using the NETBEANS standard debugging bar. (On the first version ; the stack and variable debuger's frames are still hosted inside the JpyDbg panel as in jEdit ... But I plan to improve this topic in the near future.
The rest of the functionalities are the same for both IDE environments.
Figure 5.1. NETBEANS jpydbg python plugin overview

This chapter will describe a simple Python debugging session using JpyDbg pluggin.
Let's use the python source below as a sample source candidate for the debug session :
Example 6.1. A sample python program to illustrate a debugging session
#
# A sample List returning function
#
def buildList():
    print "this will return a sample constant list back"
    list=["dave" , "mark" , "ann" , "phil"]
    return list
#
# A sample multiplication function
#
def multiply(  a , b ):
    print "this shall add " , a , "times " , b
    c = 0
    for i in range ( 0, long(a) ):
        c = c + long(b)
    return c
#
# Unit testing startup
#
if __name__ == '__main__':
    print "testing multiply = " , multiply ("5","6")
    print "testing multiply = " , multiply (5,6)
#    print "testing multiply = " , multiply (5,6,7)
    print "testing buildlist = " , buildList()
First start JEdit environment as usual and load the firstsample.py python source :
Tip
in order to dock jpydb plugin in the bottom of the screen use global option JEdit docking action
Figure 6.1. Jedit Python debugging integration overview

Two prerequisites are necessary in order to start a debugging session : you must choose a python source candidate and setup the command line arguments which will be populated to the __main__ python entry.
In order to define a python source candidate just bring your python program as current Jedit edited buffer , this action will populate the full path name to jpydbg toolbar textfield as follow :
Figure 6.2. candidate source to debugging session field

Tip
If the above debugging session fields is blank A python shell session only will be launched and a WARNING :: no python debuggee provided message will be issued at the bottom of the jpydbg jedit pane.
In that case you can still start and test python command in the python shell area until you stop the python session using the red cross button , but the python debugger will not be active.
NON PYTHON suffixed files (not ending with .py) are not populated into the debugging session field area.
Next in order to set the debuggee's command line argv you just need to select an argv configuration key using the argument combo box located on the jpydbg toolbar :
Figure 6.3. combo box to be used to bind debuggee with an argument configuration

The selected configuration bind will be saved for later debugging session with the selected source.
Tip
pointing the mouse over the combo selected item will populate a tooltip over the combo indicating the current content of the selected configuration.
Finallly in order to start debugging current source just push the green arrow located on the jpydbg toolbar.
The pluggin will then start the jpdaemon.py debuggin daemon and the debugging session will be active
The current source line will be highlited by a tiny arrow :
Figure 6.4. stopped in source illustration

setting a breakpoint at a given line in the source is achieved by clicking in the corresponding line gutter ; a red circle indicates that the breakpoint has been set . set Breakpoints are saved on disk inside jpydbg user's configuration file.
Figure 6.5. a breakpoint has been set

As soon as the debugger is active , the command field in the bottom of the debugging tabpane may be used to enter Python commands , corresponding results are populated inside the textarea panel above :
Figure 6.6. python shell dynamic command input

On top of JPyDbg pluggin , a button bar is made available and contains misc debugging action buttons :
Figure 6.7. debugging command button bar

from left to right corresponding button's actions are : Stop debugging session , Run , Step over , step into.
When clicking on the 'Variables' tabpane a view of the stack and the Global + Local variables values are displayed on the Screen inside the 'Python Object Memory Browser' panel ; Python Object instances are sorted 'by name' , object types icons are provided as a practical eye catcher between different object types and last but not least double clicking on final object nodes value provide the capalbility of changing the current object value. The call stack frame is also populated and stack positions are selectables from the corresponding combo box.
Figure 6.8. stack selection + Python execution value display and modification

Tip
Starting with version 0.0.9 of jpydbg moving the mouse over a python variable inside Jedit python source editor at debug time , makes an immediate evaluation of the variable and the result of evaluation which shows up inside a tooltip close to the variable. In the same way if the expression you want to be evaluated inside the editor contains more tokens , just select the expression inside jedit editor and move your mouse over the selected area , this will proceed with the evaluation of the selected python expression inside a tootiptext..
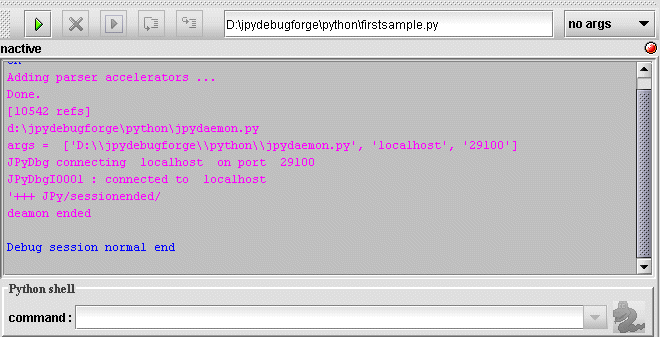
finally when you need to stop current python debugging session , just click on the red cross button , the current python debugding session will be terminated and following display will show up on the screen indicating that the socket connection with the debugger's daemon is now over .
Figure 6.9. current python debugging session is over
One of the fundamental debugging functionality consists in the capability of changing variables value content during a debugging session.
Jpydbg provides multiple ways of addressing this functionality.
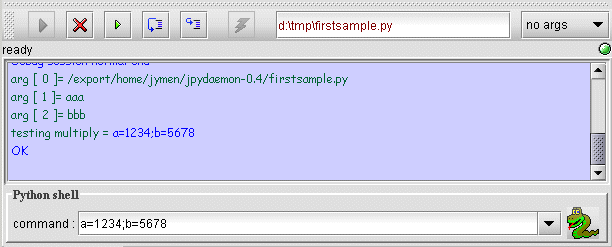
first one is through the python command line shell, as shown below for changing dynamicaly the multiply a and b parameters value of the multiply method.
Figure 7.1. changing a , b values thru python shell
Tip
when multiple variables need to be modified , use the ;(semicolon) separator to populate them to the debugger.(YOU MUST POPULATE ALL VARIABLES IN A SINGLE COMMAND , ELSE PYTHON WILL RESET THE PREVIOUS CHANGES)
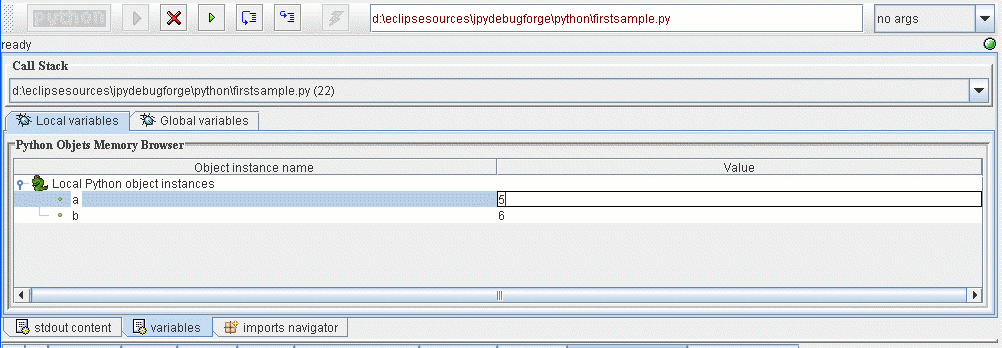
second is through the variables tabpane, as shown below for changing dynamicaly the multiply a parameters value of the multiply method.
multiple values may be changed inside the table , the changes will be populated just before execution of next debugger instruction.
Figure 7.2. changing a values by double clicking the value field of the variable table
In this chapter will show how to start and operate remote debugging python sessions.
This functionality is not implemented yet for NETBEANS plugin ... It's in the todo list.
Beeing able to supervise and debug a remotely running Python program may be interesting when for instance you are not able to setup a GUI Jedit environment on the remote computer , or for debugging remotely runnnin daemons. We will now describe how to be able to use this functionality using jpydbg
Let's use the same python firstsample.py source as in previous chapter.
First we need to check that the configuration field 'temporary work directory' is pointing to en existing acceptable local work directory. This directory will be used to locally store the remote debugged python sources.
The first step will consist in pushing the yellow arrow button on the right of the toolbar in order to put the jpydbg in listening mode over an IP session ; the port used for listening on incoming connection is configured in the 'listening port' field of the jpydbg configuration panel.
As soon as the yellow arrow button has been pressed , jpydbg waits listening for incoming connections and the debug toolbar looks as follow :
Figure 8.1. jpydbg listening for incoming remote debug connection

Pressing the red cross will then terminate the listening state and return back to the inactive stopped state of the debugger.
Next action will consist in starting a jpydeamon.py debugging instance on the remote debugged station , in order to do that we only need to have a telnet or X11 session available , let's do that through a telnet jta windows plugging instance ( you may use also any external telnet or X11 window session to do that as well ):
Figure 8.2. Launch of the jpydaemon from a telnet session

the following parameters need to be provided at jpydaemon launch time:
jpydaemon.py desthostaddress destport debuggeesname [optional python debuggee's param]
jpydaemon command line arguments
- desthostaddress
-
define the IP address of the listening jedit/jpydbg debugger
- desport
-
define the IPportnumber of the listening jedit/jpydbg debugger
- debuggees name
-
python program debugging name (PYTHONPATH environment variable should be set accordingly)
- optional python debuggee's param
-
provide here any command line parameters requested by the candidate debuggee
The python import navigator panel has been introduced in version 0.0.9 of jpydbg , in order to provide a practical way of both managing the PYTHONPATH location for jpydbg session, quickly checking that requested modules inside a project are loaded without any error , and finally providing a complementary semantic navigation tools accross the python source modules used by a given python module.
to activate the import navigator panel from the Jedit Python environment just click on the 'Python Environment tabpane button , the following panel will show up for the jedit current source
Figure 9.1. initial view of the imports navigator pane

The left part of the pane represents a tree containing the python modules requested to be imported by the current jedit python source.
The right part of the pane represents the list of the directories appended to sys.path by during a debugging session : the directories where Python will look for a requested python module. This panel is the same as the one available inside the CPython / Jpython configuration panels
Element of the list may be updated by double clicking on the element
after selecting a row inside the PYTHONPATH table, clicking on the left mouse button over this table will show up a complementary popup menu , which may be used to add or remove elements to the path relative to the current selected row, or save the list on disk
Tip
The PYTHONPATH content must be saved before checking the left tree or starting a new debugging session in order for the current changes to be taken into account.
The module tree on the left side of the pane may be used to recursively view the import semantics of a given python project , and to navigate between python module sources
-
double clicking on the root node .
will reload the tree for the current python source
-
represents a python source module , doubleclicking on it will bring the corresponding source inside jedit and expand a python subtree recursively showing imported modules of this newly loaded python source.

-
represents a broken python imported module : the requested resource was not loadable using the provided PYTHONPATH tree on the right ; when this occurs, you need to review the path update it accordingly, save it back on disk using the right mouse popup, and retry the full load by doubleclicking on the parent node of the unresolved item or the root node itself.

-
represents a python builtin imported module.

-
represents a python binary imported module.

The picture bellow shows a more sophisticated view of a python imports expanded tree in action
Figure 9.2. final overview of import navigator panel

This chapter asumes that pylint has been previously installed as described on the pylint site http://www.logilab.org/projects/pylint
As soon as the use pylint option is toggled in the pylint option pane ; pylint module is called on python source load and save actions ; pylint messages are shown inside the jEdit error list as shown on the screen shot below
pylint ERRORS and FATAL are populated as jEdit errors and located inside the source as red underlined lines ; a tiny red marker is also visible on the right gutter of the editor as well ; pointing the mouse on the erroneous line will popup a tooltiptext with the associated pylint error message inside.
pylint WARNINGS , CONVENTION and REFACTOR are populated as jEdit warnings and located inside the source as yellow underlined lines ; a tiny yellow marker is also visible on the right gutter of the editor as well ; pointing the mouse on the erroneous line will popup a tooltiptext with the associated pylint error message inside
To correct an error just modify the erroneous line inside the editor and save the source ; this action will relaunch pylint to check youor correction.
Figure 10.1. Source with pylint messages

The left part of the pane represents a tree containing the python modules requested to be imported by the current jedit python source.
The right part of the pane represents the list of the directories appended to sys.path by during a debugging session : the directories where Python will look for a requested python module. This panel is the same as the one available inside the CPython / Jpython configuration panels
Element of the list may be updated by double clicking on the element
after selecting a row inside the PYTHONPATH table, clicking on the left mouse button over this table will show up a complementary popup menu , which may be used to add or remove elements to the path relative to the current selected row, or save the list on disk
Tip
JpyDbg pylint error reporting is using the Jedit ErrorList plugin to populate pylint errors and warnings to the console ; You can customize the ErrorList pluggin to automatically show up pylint errors through the ErrorList customization panel ( check the 'automatically display on error' checkbox ).
-
Initial release.
-
0.0.2 : documentation enhancements + description of 0.0.2 jpydbg functionalities.
-
0.0.4 : documentation enhancements + description of 0.0.4 jpydbg functionalities.
-
0.0.5 : documentation enhancements + description of 0.0.5 jpydbg functionalities.
-
0.0.9 : documentation enhancements + description of 0.0.9 jpydbg functionalities.
-
0.0.10 : documentation enhancements + description of 0.0.10 jpydbg functionalities
-
0.0.12 : documentation enhancements + description of 0.0.12 jpydbg functionalities
-
0.0.13 : documentation enhancements + description of 0.0.13 jpydbg functionalities
-
0.0.13 : documentation enhancements + description of 0.0.14 jpydbg JEDIT+ NETBEANS functionalities

